1.8.7677123.8 MB
GPL-3.0-or-later
strict
core24
Plot and manipulate data


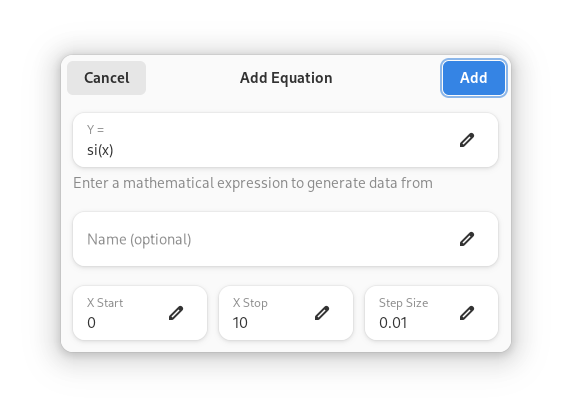

Graphs is a simple, yet powerful tool that allows you to plot and manipulate your data with ease. New data can be imported from a wide variety of filetypes, or generated by equation.
All data can be manipulated using a variety of operations such as the ability to select, cut, translate, multiply, center and smoothen data, as well as apply any custom transformations on the data.
Moreover, Graphs supports curve fitting on imported data and offers extensive customization options for the style of the plots. You can fine-tune and personalize stylesheets to your liking.
Graphs is an excellent fit for both plotting and data manipulation. The plots created with Graphs can be saved in a variety of formats suitable for sharing and presenting to a wide audience, such as in a scientific publication or presentations.
Additionally, the option to save plots as vector images allows for easy editing in software like Inkscape for further refinement. Graphs is written with the GNOME environment in mind, but should be suitable for any other desktop environment as well.
For any feedback, questions or general issues, please file an issue on the GitLab page.
Update History
1.8.5 (595) → 1.8.7 (677)9 Jan 2026, 09:24 UTC
1.8.5 (595)13 Dec 2025, 09:47 UTC
23 Apr 2023, 14:59 UTC
8 Jan 2026, 10:10 UTC
13 Dec 2025, 09:47 UTC