2.12.087162.6 MB
GPL-2.0+
strict
core24
Interactive Data Visualization and Analysis
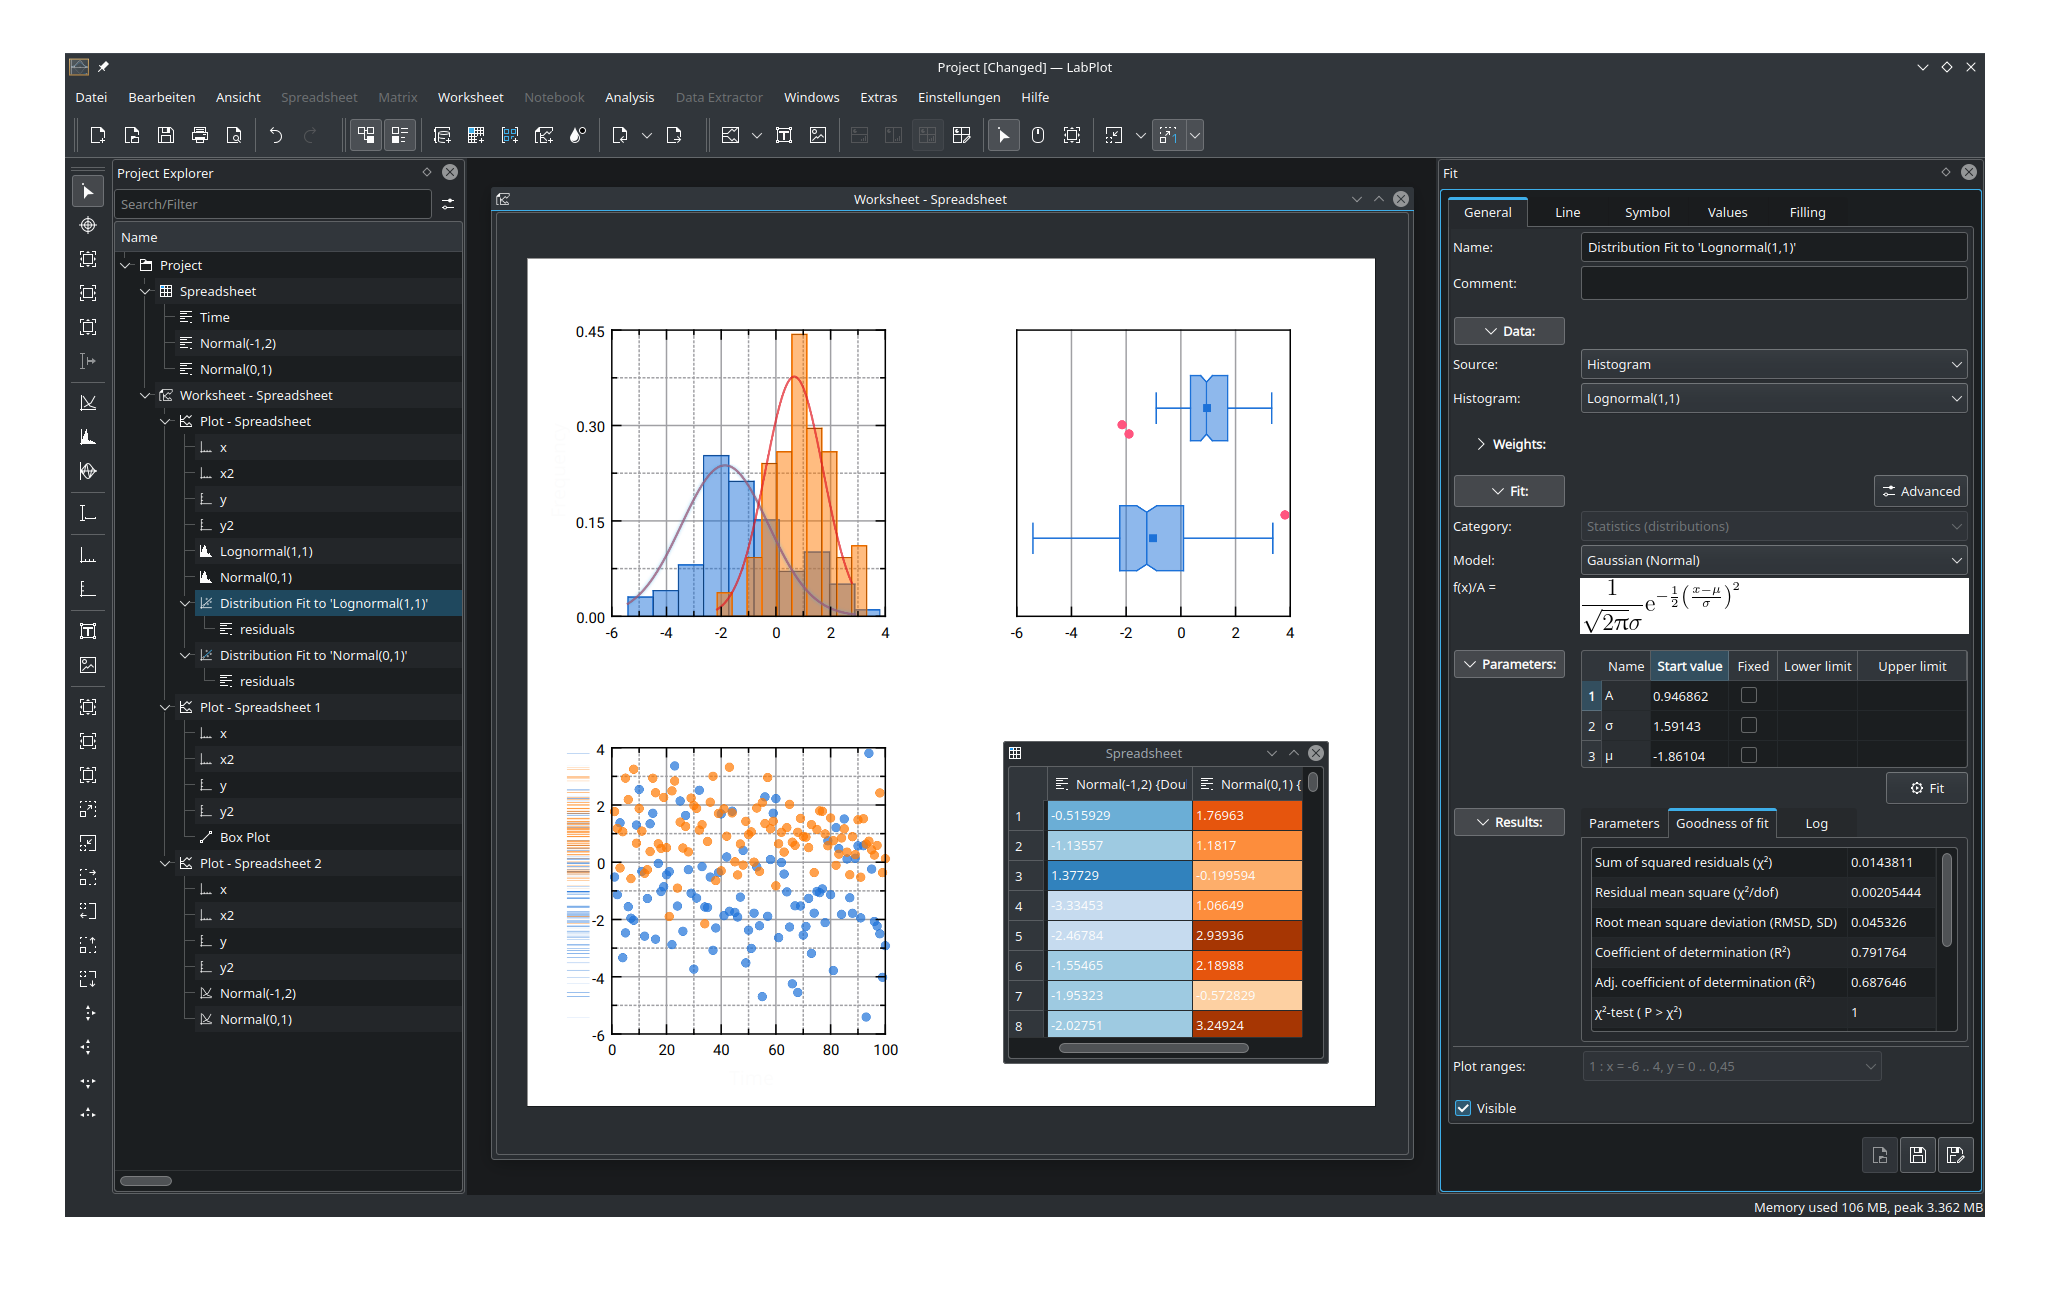
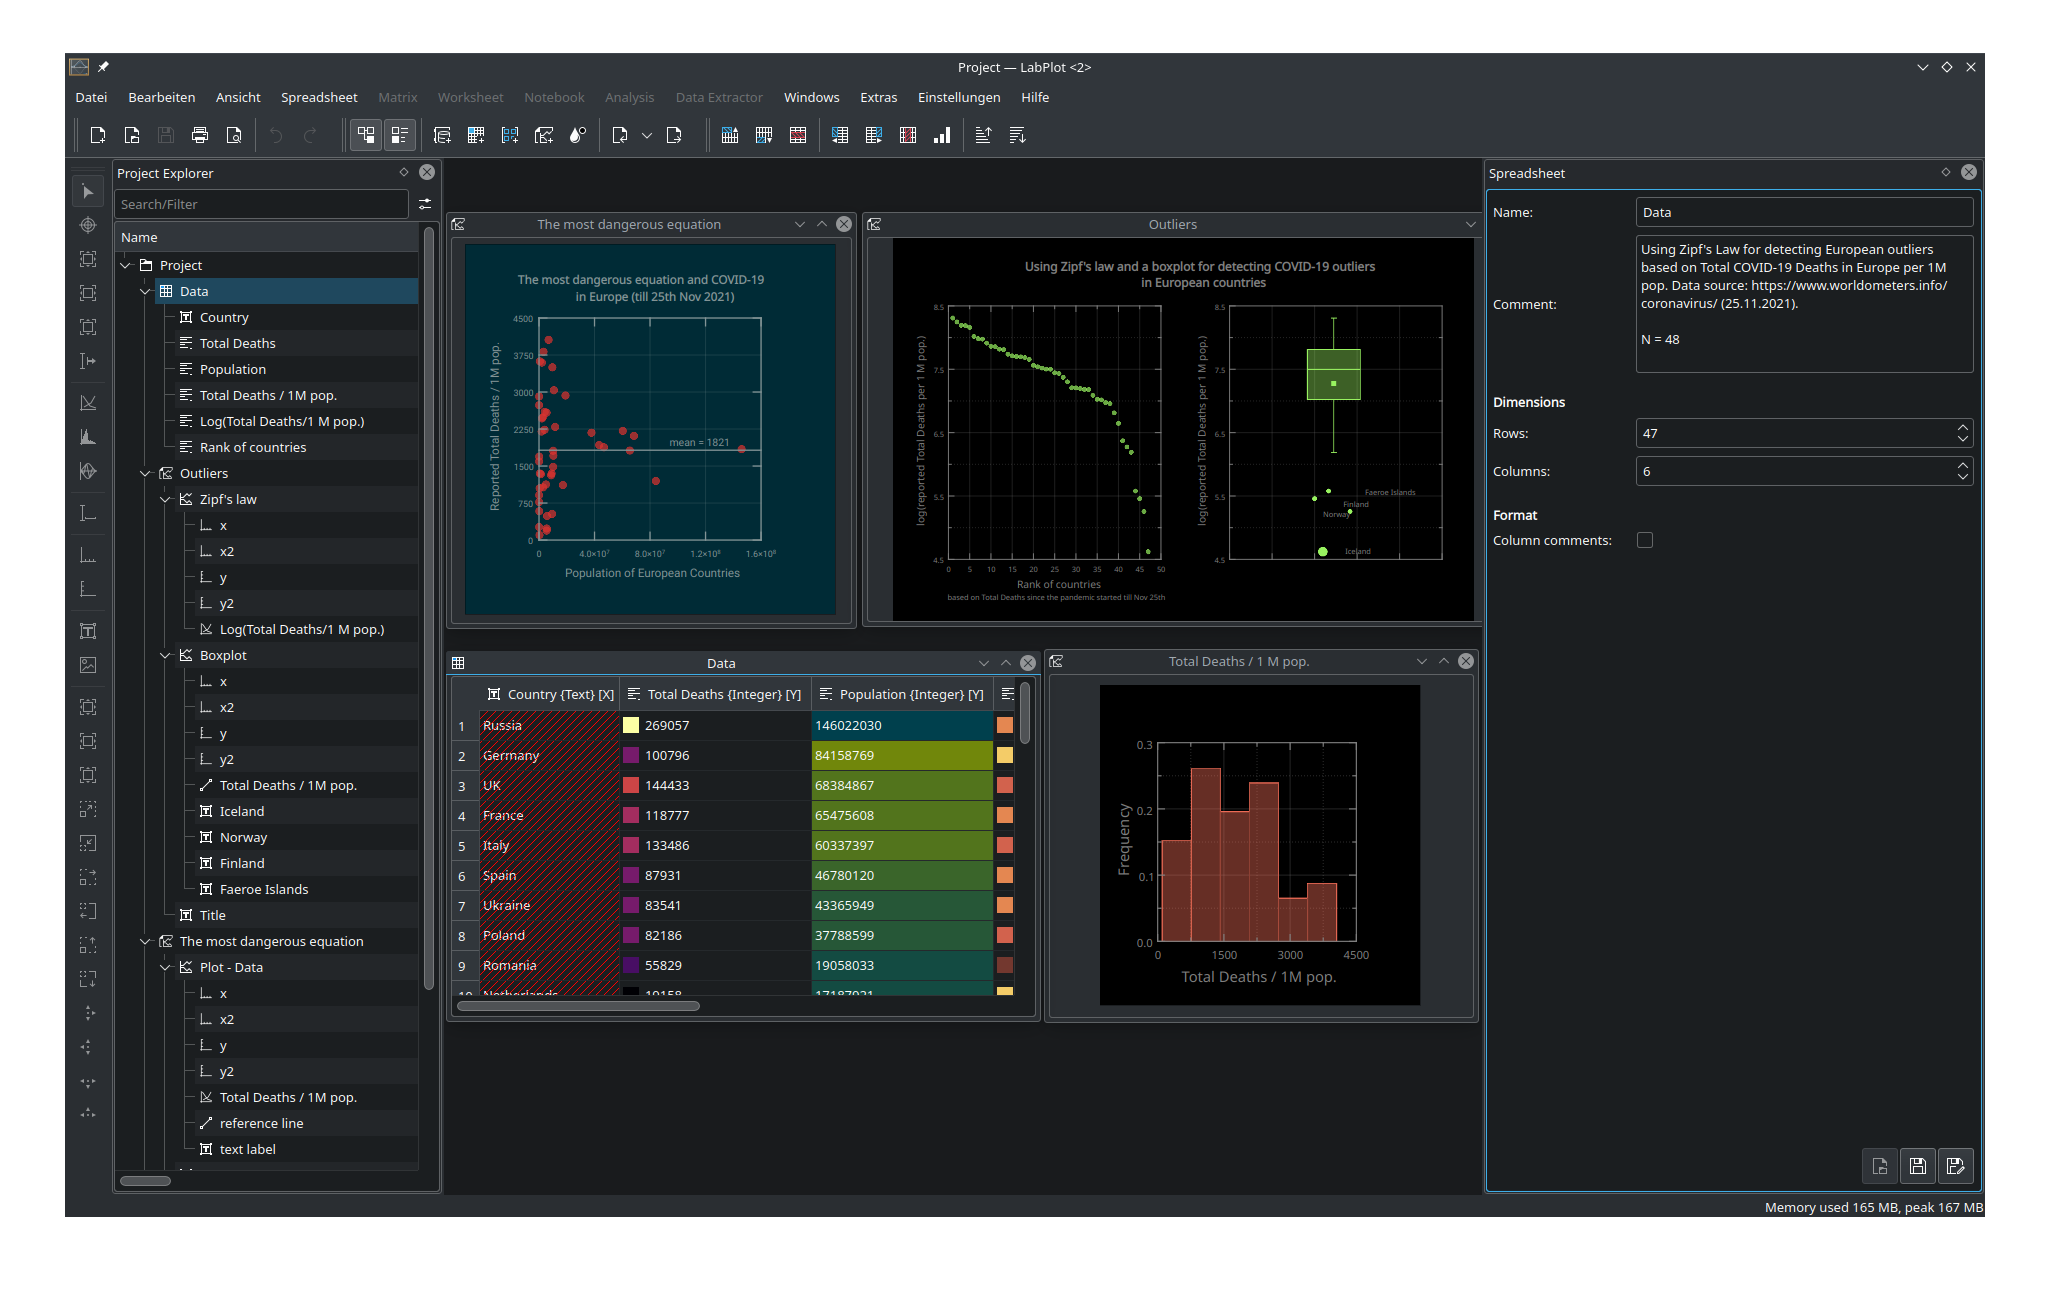
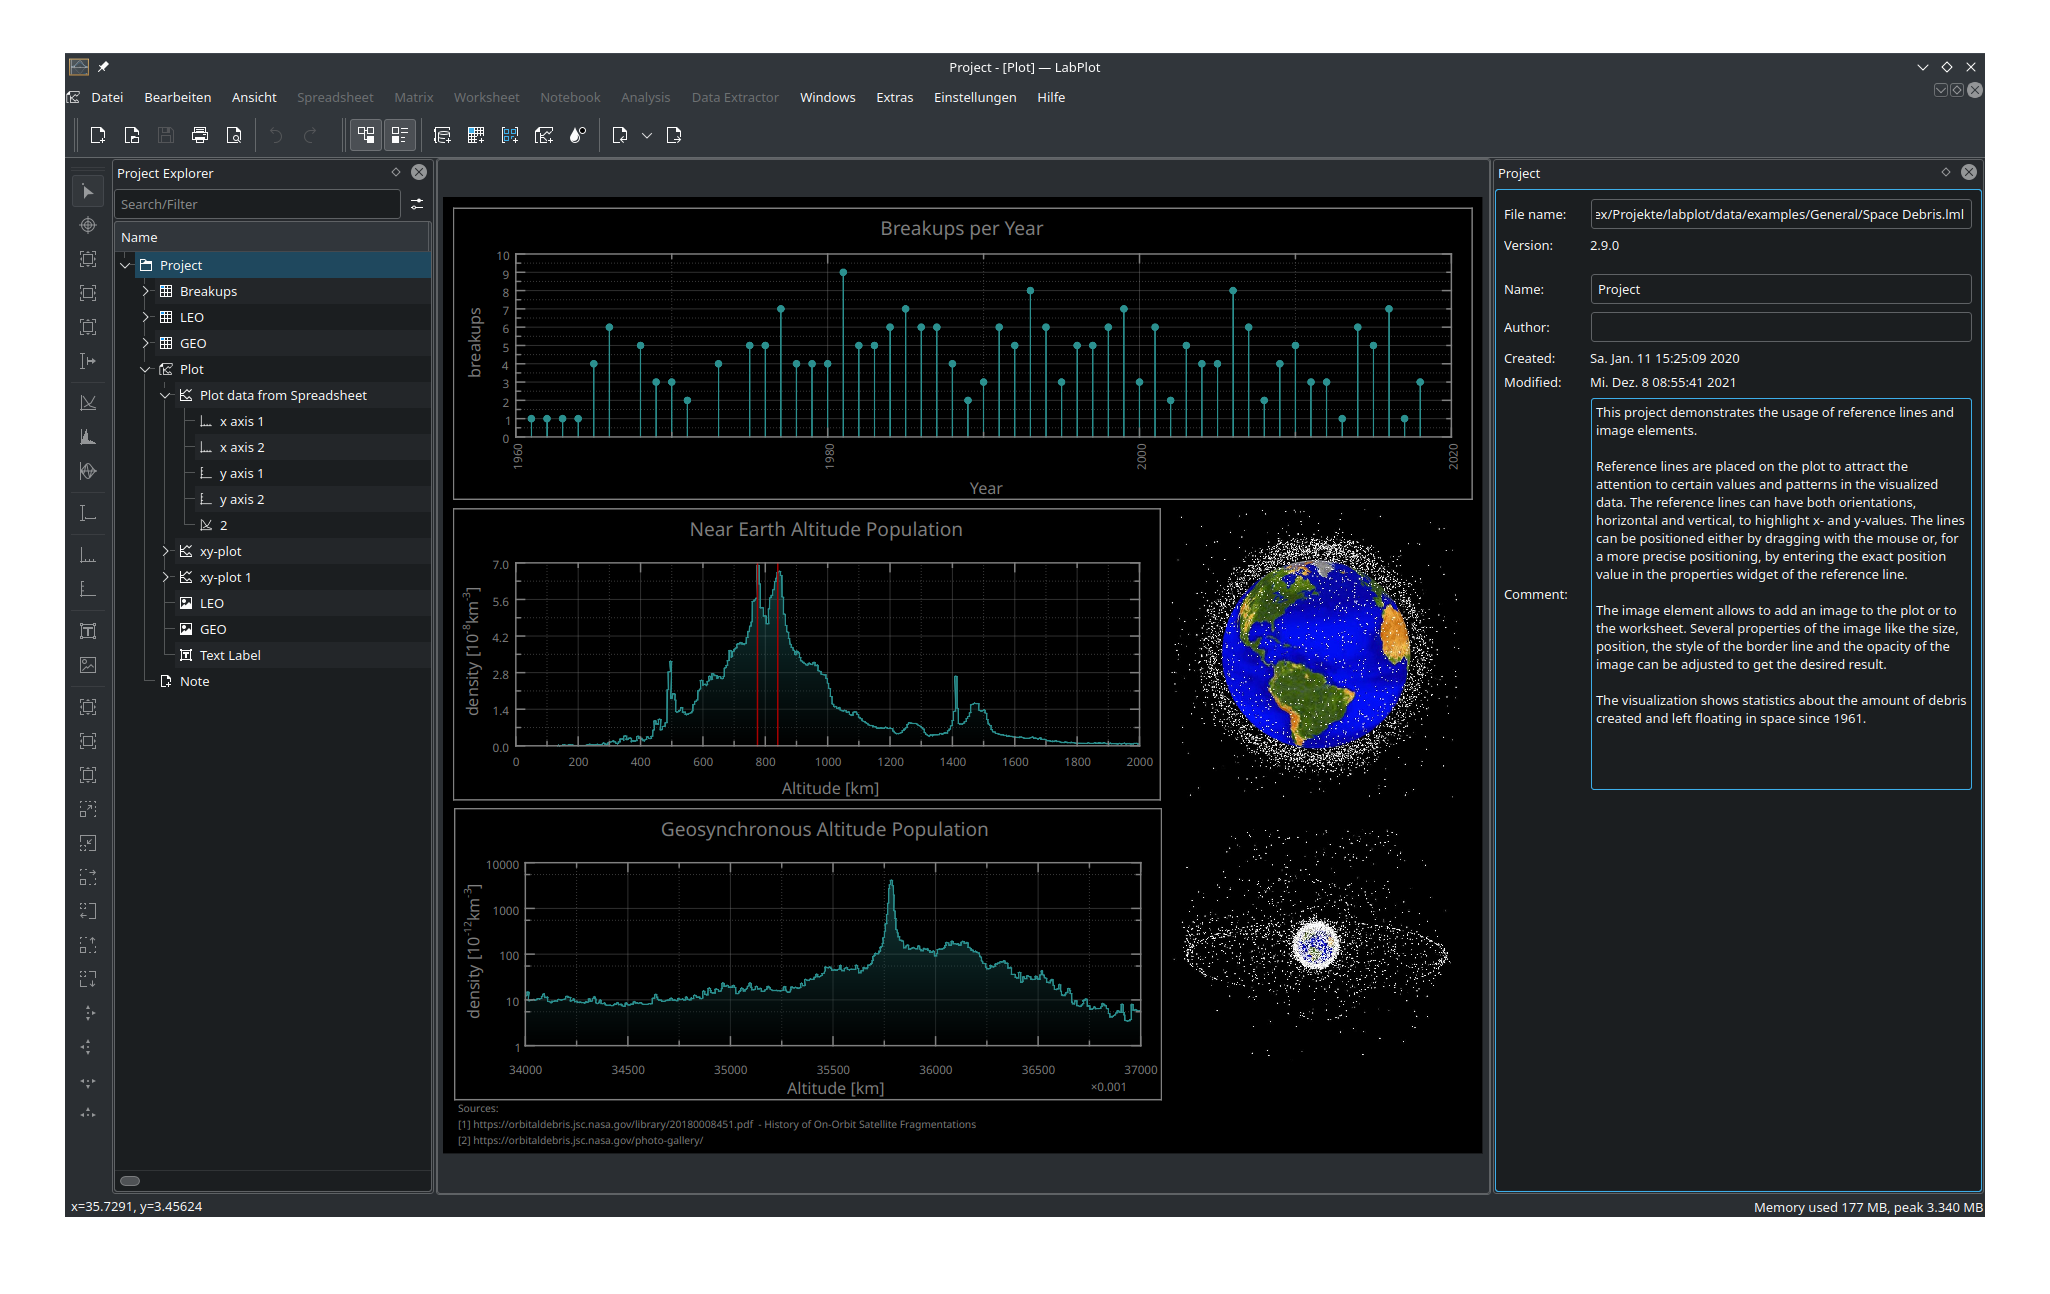
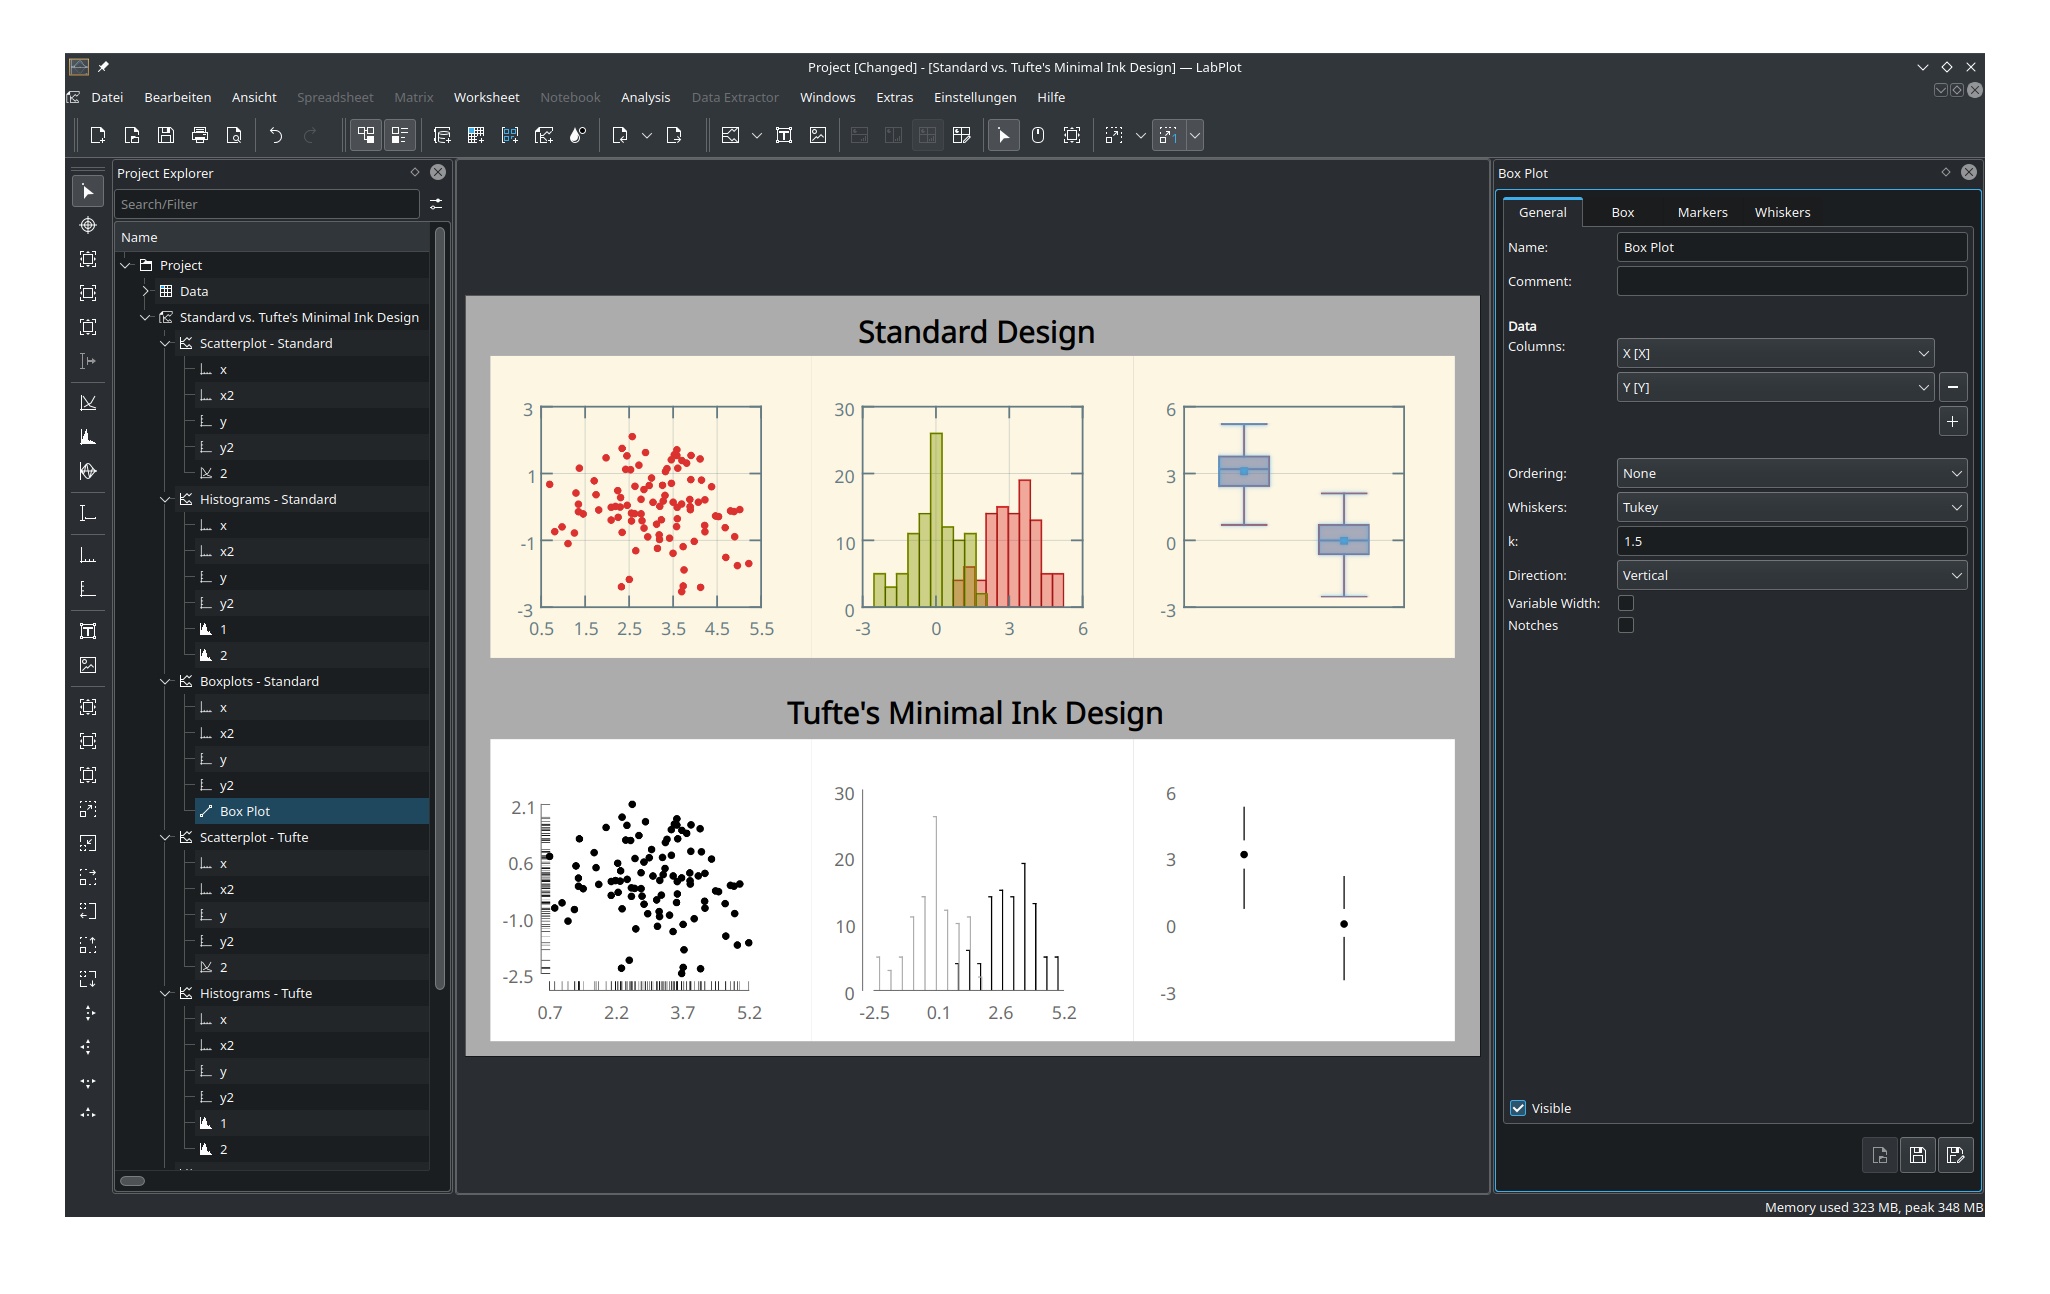
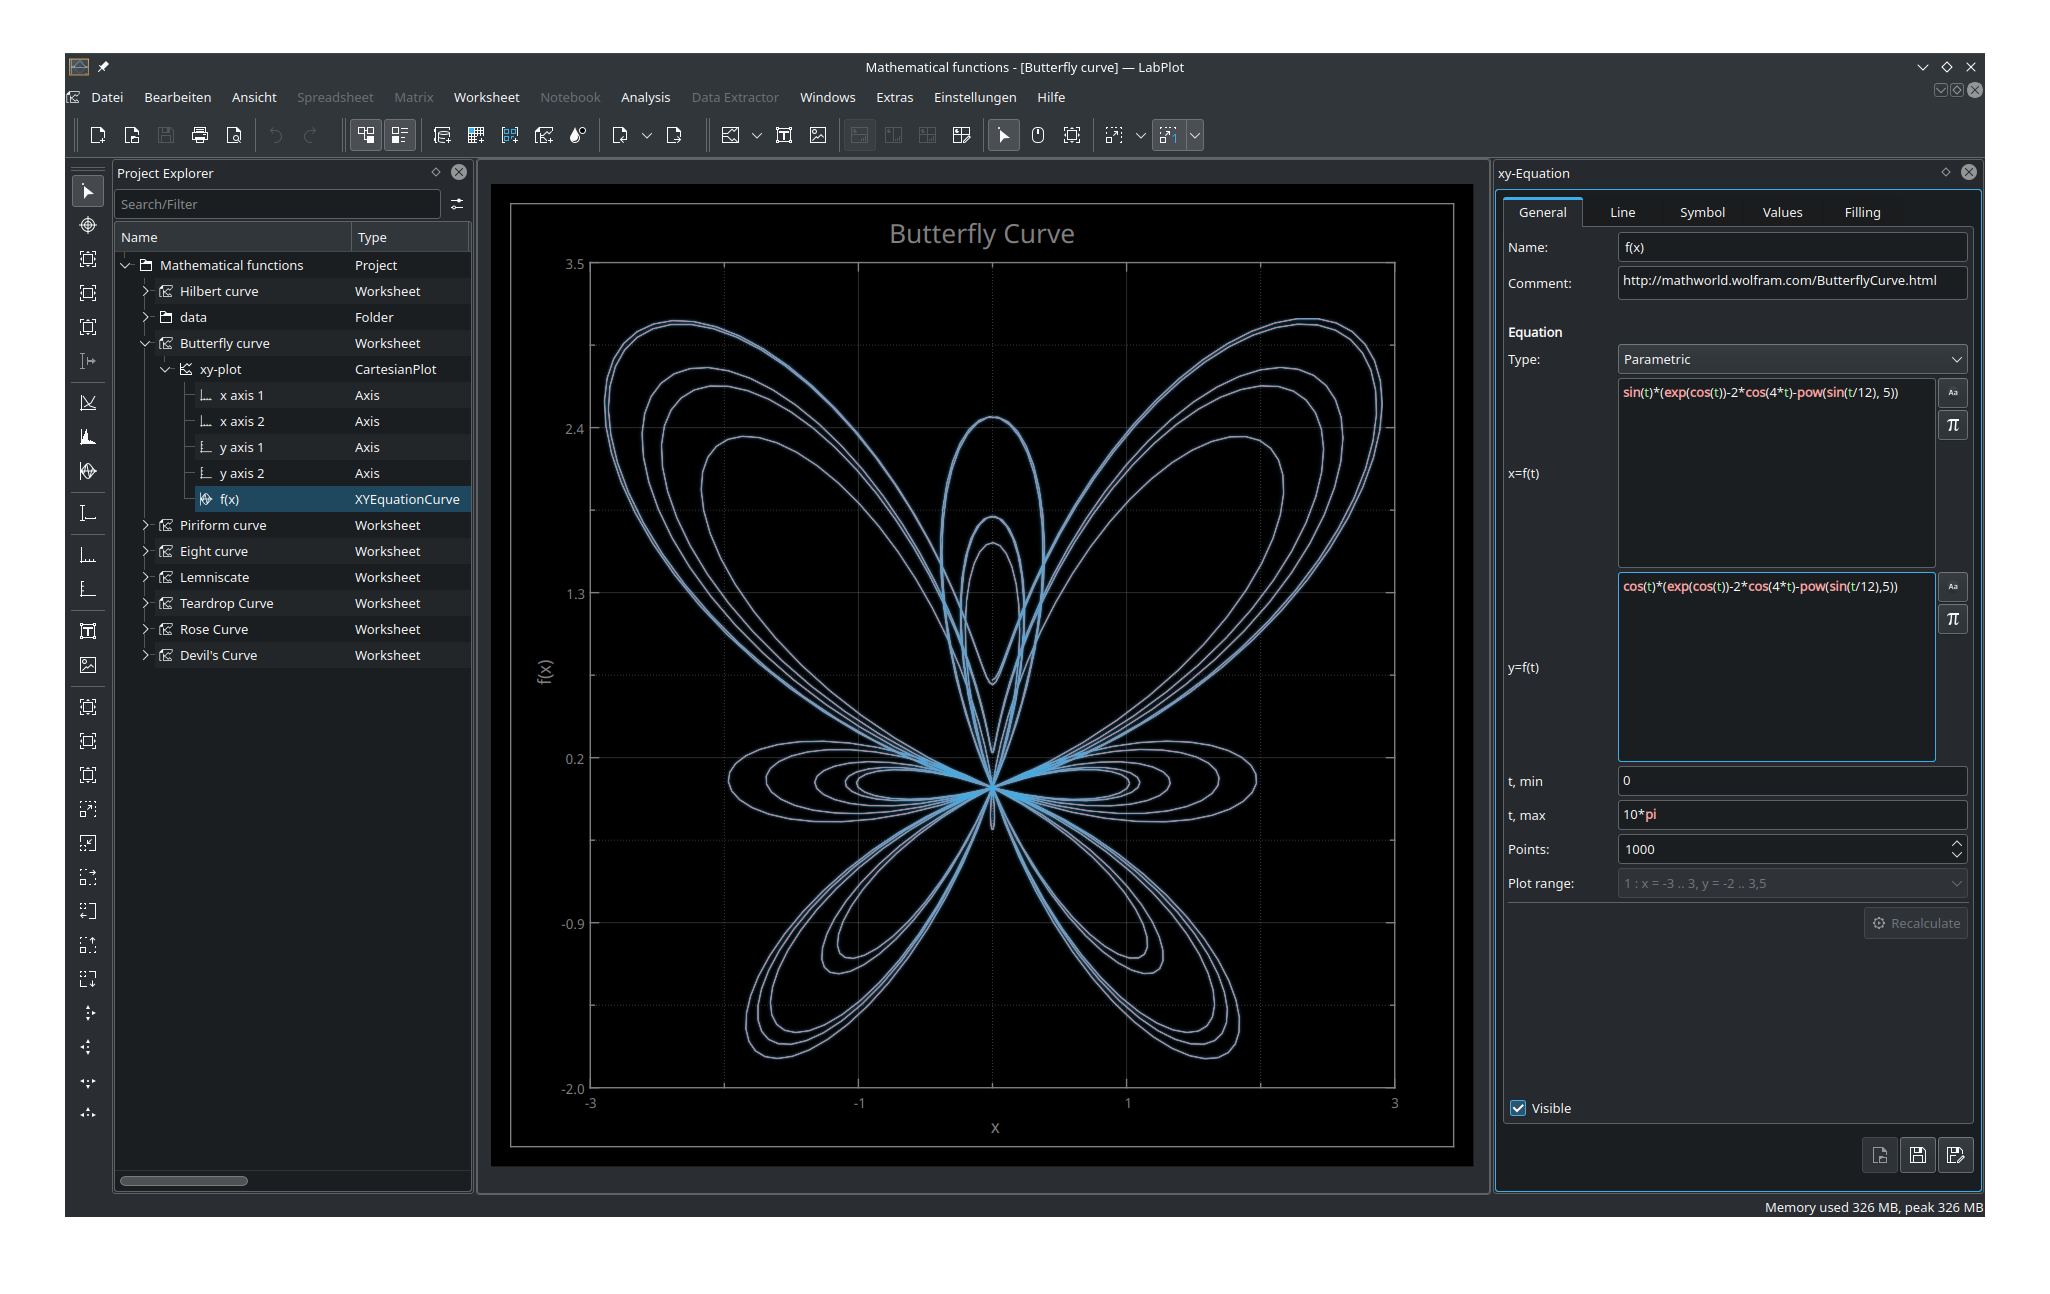
LabPlot is a FREE, open source and cross-platform Data Visualization and Analysis software accessible to everyone.
- See your data instantly within a few clicks. No programming needed!
- Publication quality plots
- Data extraction from plots
- Viewing and recording Live Data
- Statistics, linear and non-linear regression analysis, curve fitting and smoothing
- Drag & drop import from CSV, SAS, Stata, and SPSS, Origin, MATLAB, SQL
- Interactive programming notebooks for advanced users (support for Python, R, Julia, Octave, SciLab, Maxima and others)
Update History
2.12.0 (87)13 Dec 2025, 09:47 UTC
3 Oct 2017, 14:34 UTC
23 Jun 2025, 12:31 UTC
13 Dec 2025, 09:47 UTC