0.8.52536.8 MB
GPL-3.0-only
strict
core22
Simple graph plotting
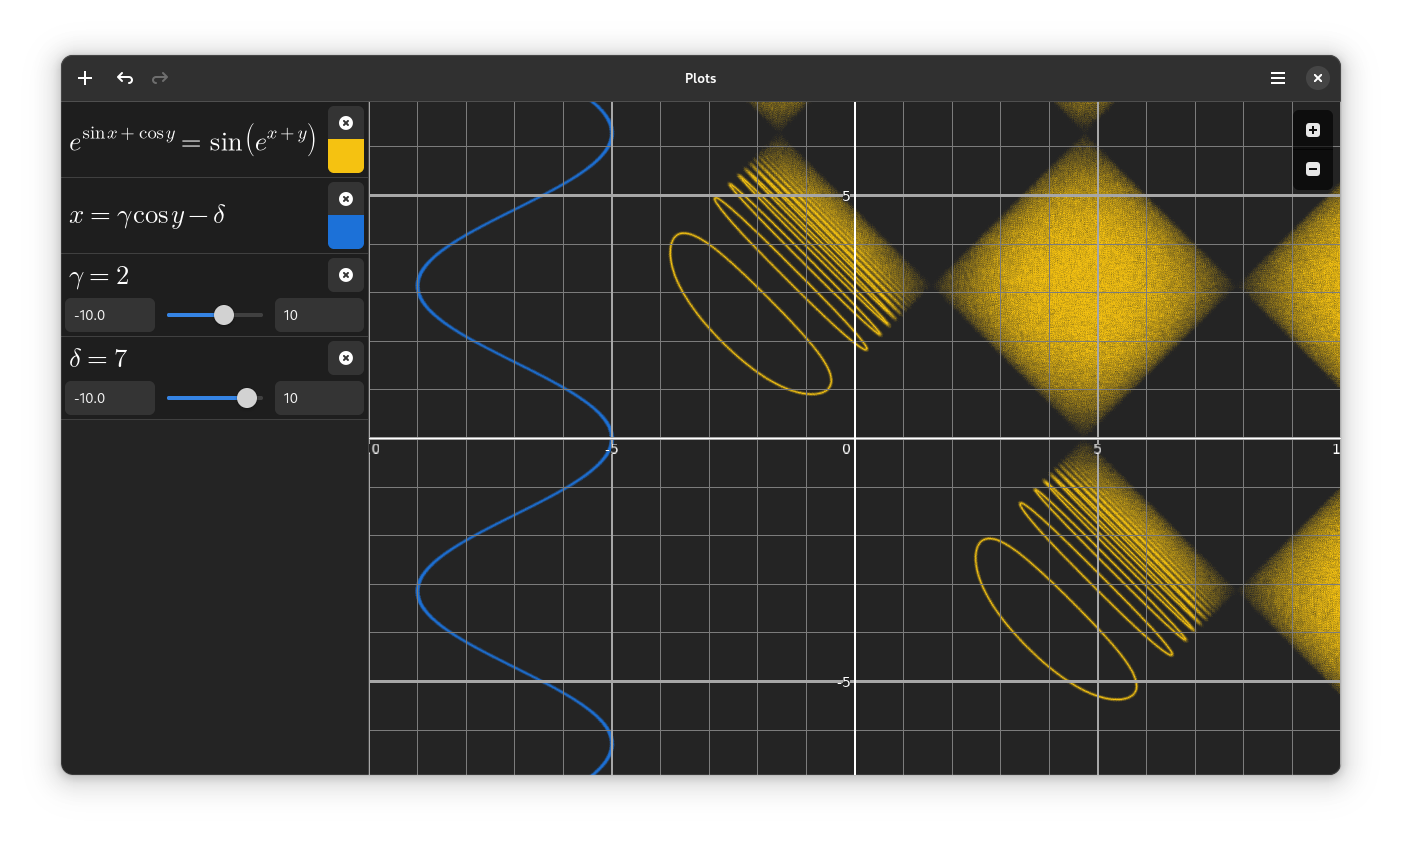

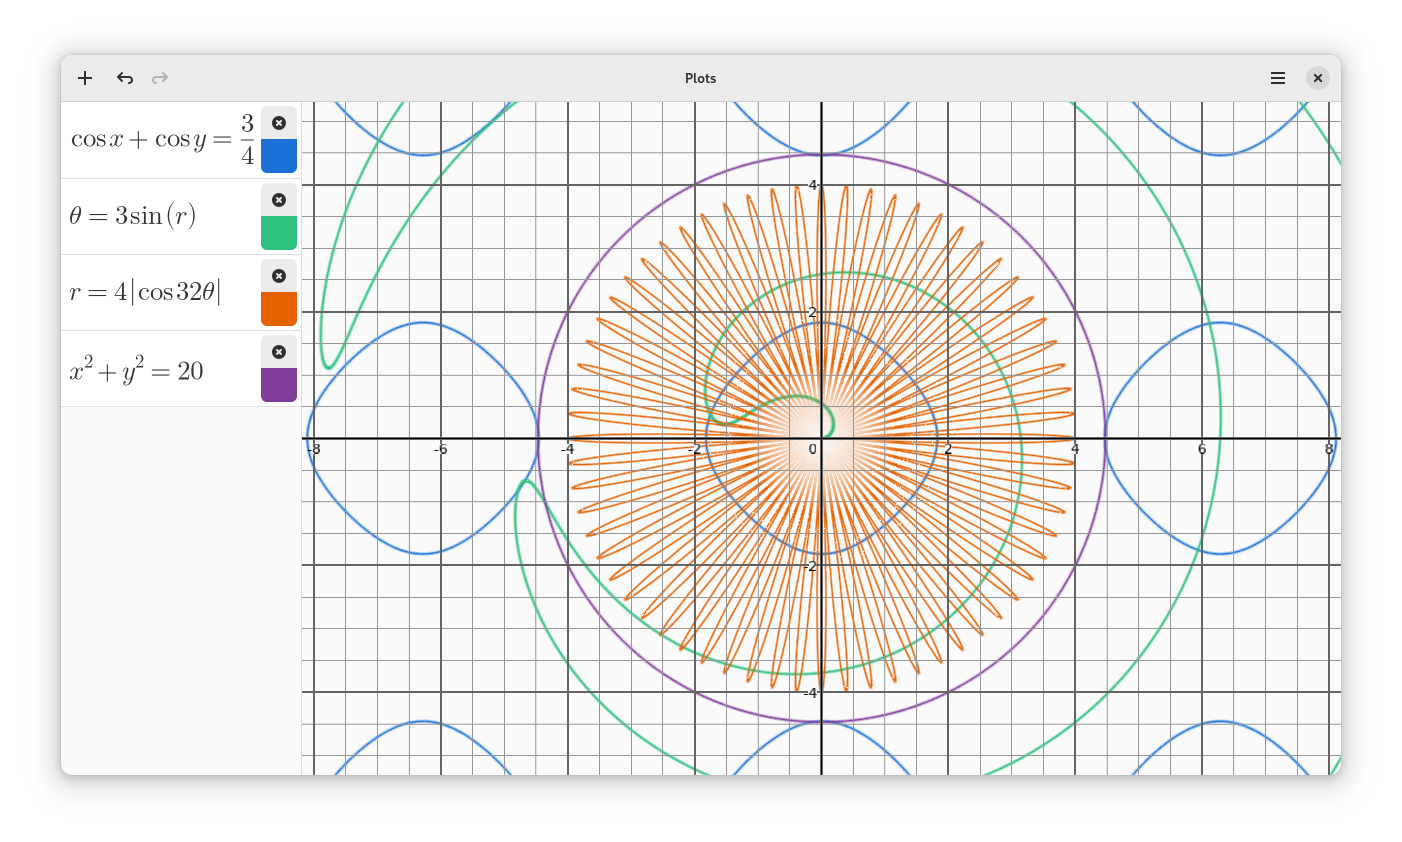
Plots makes it easy to visualise mathematical formulae. In addition to basic
arithmetic operations, it supports trigonometric, hyperbolic, exponential and
logarithmic functions, as well as arbitrary sums and products. It can display
polar equations, and both implicit and explicit Cartesian equations.
Plots is designed to integrate well with the GNOME desktop and takes advantage
of modern hardware using OpenGL.
Project Website: https://github.com/alexhuntley/Plots
Update History
0.8.5 (25)13 Dec 2025, 09:47 UTC
20 Apr 2023, 07:59 UTC
13 Aug 2023, 09:13 UTC
13 Dec 2025, 09:47 UTC